雅思小作文出现三个不同类别的图时,评分重点在于:能否发现并写出不同图表之间的强关联。
原题
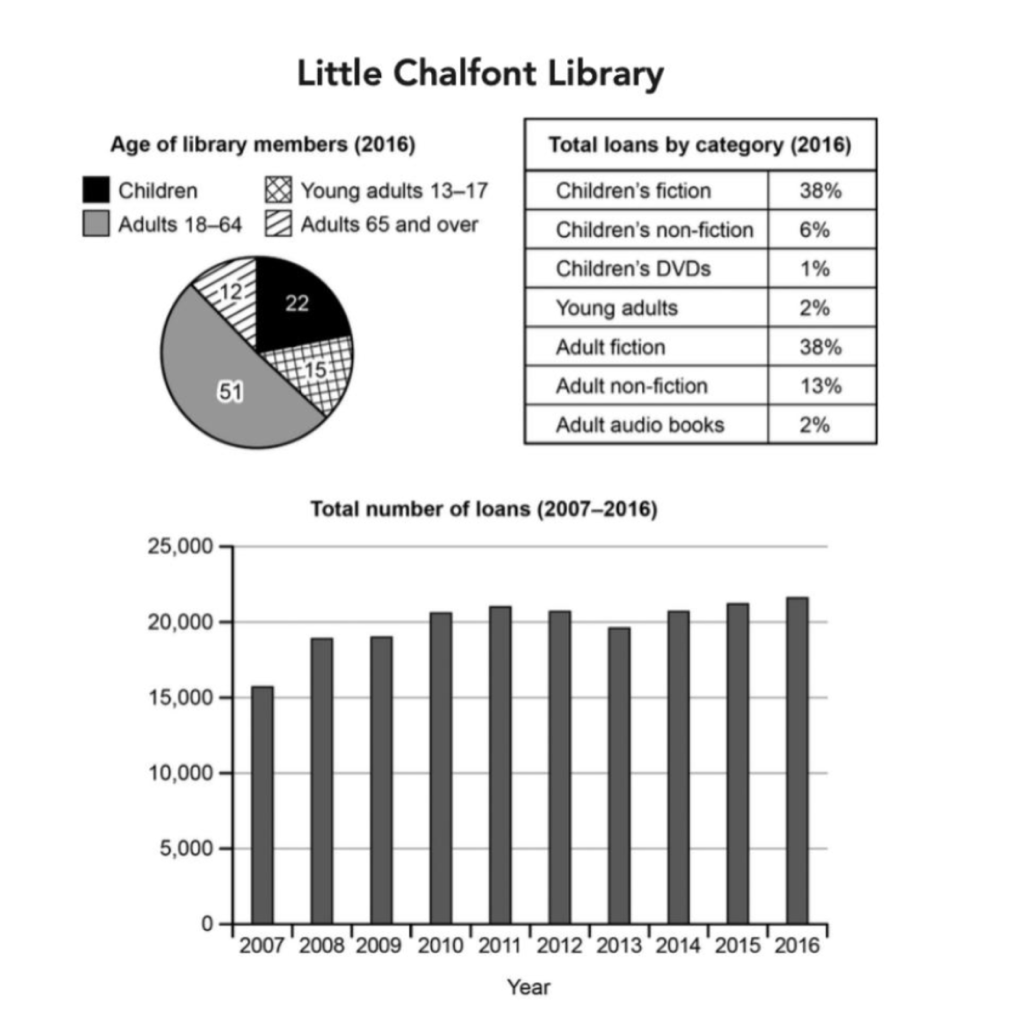
The charts below give information about a public library in a town called Little Chalfont.
四段结构拆解
第一段:改写原题(Paraphrase)
方法: 饼图与表格关联明显(同为 2016 年数据,均按年龄分组),用 while 并列;用 as for 引出柱状图。
The pie chart illustrates the distribution of library members by four age groups in 2016, while the table shows the percentage of loans by category. As for the bar chart, it compares total annual loans from 2007 to 2016.
第二段:总体概述(Overview)
方法: 用三个不同的"极值"表达概括三图特点,避免重复。
| 极值表达 | 内容 |
|---|---|
| the majority of | 成员以成年人为主 |
| the most | 小说类借阅量最高 |
| the highest level | 年借阅量在10年间达到峰值 |
In Little Chalfont Library, in 2016, the majority of members were adults and the most loans were from the fiction category. Overall, annual loans increased to their highest level across the given 10-year period.
第三段:细节描述——跨图比较(核心得分段)
方法: 比较饼图与表格,挖掘成员构成与借阅量之间的"反差"与"趋势一致"。
写作逻辑
成年人成员 63%  →  成人类借阅 53%   ✅ 趋势一致
儿童成员   22%  →  儿童类借阅 45%   ⚠️ 反差(超 2 倍)
青少年成员 15%  →  青少年类借阅 2%  ❗ 巨大反差
According to the pie chart, adults aged 18–64 and those aged 65 and above together accounted for 63%, followed by children at 22% and young adults at 15%.
The table shows that adult loans — fiction, non-fiction, audio books — represented 53%, while children's loans including fiction, non-fiction, and DVDs reached 45%, more than twice the proportion of children members (22%).
Although young adults made up 15% of the library users, the proportion of loans in the category of "young adult" was only 2%.
第四段:柱状图(单独收尾)
方法: 柱状图与前两图关联较弱,单独成段,抓三个重点:起点最低 → 中间起伏 → 终点最高。
In 2007, the figure for annual loans was at the lowest point: approximately 16,000. The number of loans fluctuated moderately in the following years before reaching its peak at around 22,000 in 2016.
完整范文
The pie chart illustrates the distribution of library members by four age groups in 2016, while the table shows the percentage of loans by category. As for the bar chart, it compares total annual loans from 2007 to 2016.
In Little Chalfont Library, in 2016, the majority of members were adults and the most loans were from the fiction category. Overall, annual loans increased to their highest level across the given 10-year period.
According to the pie chart, adults aged 18–64 and those aged 65 and above together accounted for 63%, followed by children at 22% and young adults at 15%. The table shows that adult loans — fiction, non-fiction, audio books — represented 53%, while children's loans including fiction, non-fiction, and DVDs reached 45%, more than twice the proportion of children members (22%). Although young adults made up 15% of the library users, the proportion of loans in the category of "young adult" was only 2%.
In 2007, the figure for annual loans was at the lowest point: approximately 16,000. The number of loans fluctuated moderately in the following years before reaching its peak at around 22,000 in 2016.
📌 高分提点总结
- 不逐图写,找最强关联的两图做跨图比较,写出反差与趋势一致——这是多图组合题的评分核心。
- 关联较弱的图单独成段,简洁收尾,无需逐年细述(字数与时间均不允许面面俱到)。
- 开头段与概述段必须提及全部三个图,不可遗漏。