小作文练了20篇,分数还是卡在5.5?你可能一直在犯同一个错误。
今天我们直接拿之前高频真实考题——1975、2020及2050年(预测)全球及不同地区城市人口百分比柱状图——来手把手拆解。所有技巧来自真实考官批改经验,全是干货。
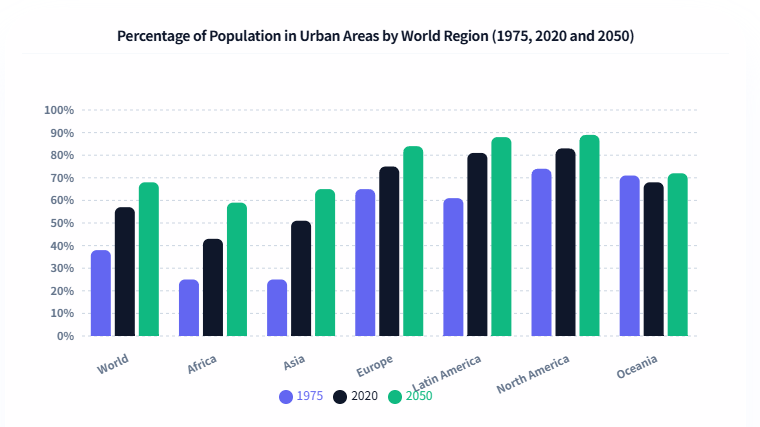
⚠️ 原题::The chart below shows the percentage of the population living in urban areas in different regions.
一、完美段落结构:千万别写结尾段
很多同学习惯性写Conclusion,但小作文时间宝贵,考官既不加分也不要求。高分结构只有两部分:开头+主体
开头段(2句话)
第1句"改写题目": 不要照抄原题,将"百分比"替换为"rates of urbanization"等同义表达。
第2句写"总体概述(Overview)": 这是整篇文章最重要的一句话。
⚠️ 如果没有清晰的Overview,你的Task Achievement项绝对拿不了高分。
这道题的Overview核心是:全球城市化水平普遍提高,但大洋洲除外。这个"例外"必须写出来,否则考官会认为你没有真正读懂图表。
满分示范:
Overall, urbanization rates rose across virtually all regions between 1975 and 2050, with Latin America experiencing the most dramatic growth and Oceania standing as a notable exception to the general upward trend.
二、数据分组:面对6个地区怎么归类最有逻辑?
很多同学看到多地区图表就慌,其实关键在于找"规律相似"的数据归为一组。
组1——亚洲 & 非洲
两者1975年均约25%,数据接近且增长轨迹相似,与全球平均数据放在同一主体段,形成对比衬托。
组2——北美、欧洲、拉丁美洲
这三个地区城市化率最高,且持续增长,归入第二段展示高位竞争态势。值得重点描述的是拉丁美洲——它在2020年反超了欧洲,是整张图最有戏剧性的数据点。
组3——大洋洲(建议单独一段)
当全球都在猛增时,只有大洋洲的趋势特立独行:整体维持在70%左右,2020年甚至略有下降。这种"异类"数据可以单独成段,是考官评判你能否识别关键信息的重要依据。
三、黄金公式:Describe & Support
尝试使用 Describe and Support(描述与支撑) 公式:
- Describe(描述趋势/定性):先用一句话概括数据含义。 👉 例如:“拉丁美洲经历了加速增长。”
- Support(数据支撑/定量):紧接着用具体的数字和年份去支撑。 👉 例如:“从 1975 年的略高于 60% 跃升,在 2020 年达到 80% 以上,反超了欧洲(overtaking Europe),并预计在 2050 年达到 87% 左右。”
⚠️ 注意: 引用的数字必须准确,灵活运用约数词(如 just over, approximately)能避免扣分。
❌ 普通写法:
Latin America was 60% in 1975, 80% in 2020, and will be 87% in 2050.
✅ 满分写法:
Latin America experienced accelerated growth, rising from just over 60% in 1975 to over 80% in 2020, overtaking Europe, and is forecast to reach around 87% by 2050.
两段话数字数量差不多,但第二段多了:
- 趋势判断:accelerated growth
- 关键对比:overtaking Europe
- 预测语态:is forecast to
这三个元素正是考官在Lexical Resource和Task Achievement上给高分的依据。
公式 = 先描述趋势(定性)→ 再用数据支撑(定量)
四、词汇与语法进阶
高级词汇替换
| 普通表达 | 高分替换 |
|---|---|
| show | demonstrate / illustrate |
| predicted | forecast |
| 75% | three-quarters |
| 25% | around a quarter |
| increase | surge / climb / rise steadily |
| decrease | decline / drop / fall sharply |
句型变化
单一句式是6分写法最常见的问题。建议在一篇文章中交替使用三种结构:
- 动词句: Asia's urbanization rate increased dramatically.
- 名词句: There was a dramatic increase in Asia's urbanization rate.
- 拟人句: Asia witnessed a dramatic rise in its urbanization rate.
预测表达
涉及2050年预测数据时,务必使用被动语态:
- is expected to reach
- is forecast to surpass
- is projected to exceed
对比连接词
- whilst / whereas:并列对比两组数据
- by contrast:段落间转折
- albeit:让步(如 albeit at a slower pace)
- in stark contrast to:强调鲜明差异
五、满分范文拆解(节选)
以下为主体段满分示范,供参考:
主体段1(低城市化地区)
In 1975, Africa and Asia recorded the lowest urbanization rates, both standing at approximately 25% — well below the world average of around 38%. However, both regions witnessed substantial growth over the period. Africa's figure is forecast to reach roughly 59% by 2050, whilst Asia is projected to surpass 65%, representing increases of over 30 percentage points in each case.
主体段2(高城市化地区)
North America and Europe were already highly urbanized in 1975, at around three-quarters and 65% respectively, and both continued to rise steadily. Latin America demonstrated the most dramatic growth among this group, climbing from just over 60% in 1975 to over 80% in 2020, overtaking Europe, and is forecast to approach 88% by 2050 — nearly matching North America's projected figure of 89%.
主体段3(大洋洲)
Oceania presented a markedly different pattern. Unlike all other regions, its urbanization rate showed no clear upward trend, remaining broadly stable at around 70% throughout the period and dipping slightly to 68% in 2020, albeit recovering marginally to a projected 72% by 2050.
行动清单
- 收藏本文,考前反复过一遍结构和词汇
- 用今天的公式在LumiWrite.cn写一篇练习,LumiWrite会帮你批改,并给出诊断及提分路径
- 关注我,获取更多雅思写作干货