雅思小作文:多表格组合图
7.5+ 选手的对比逻辑
表格类小作文的难点,不在数据,而是理不清数据之间的关系。一旦你找到了可以对比的数据,并写出它们之间的差异或变化,就抓住了关键的得分点,因为这能强有力地展现你缜密的逻辑思维。
今天,我们用一道真题,带你分析如何理出有价值的对比。
真题重现 (C20 Test 1,question id为241)
原题英文描述:
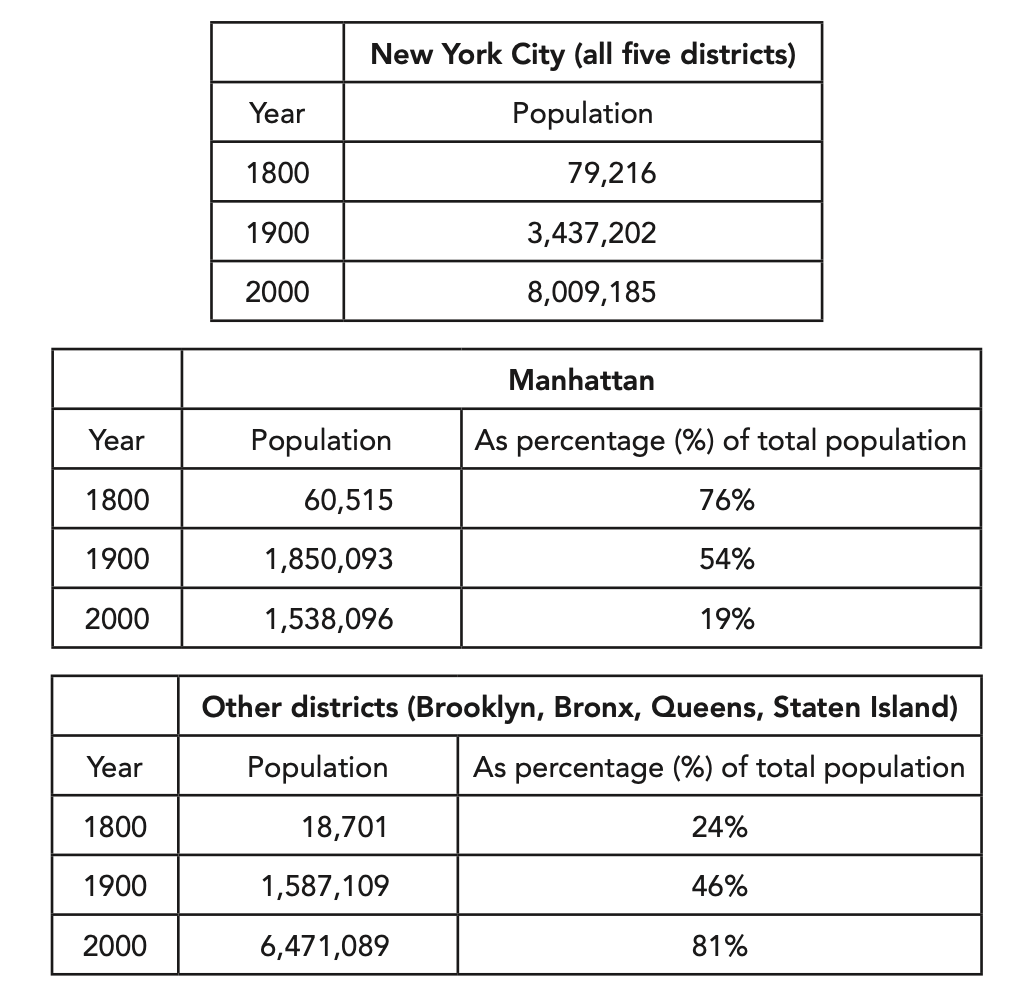
The first table below shows changes in the total population of New York City from 1800 to 2000. The second and third tables show changes in the population of the five districts of the city (Manhattan, Brooklyn, Bronx, Queens, Staten Island) over the same period.
图表核心切入点分析
在动笔改写前,我们先观察并理清这 3 张表格的内在关联:
- 第一张表格:纽约市整体人口的变化。
- 第二张和第三张表格:Manhattan 区与其他四个行政区的人口数量及占比变化。
- 核心对比:第一张表仅展示总量,而真正有价值的对比数据在后两张表中。Manhattan 的占比一路下滑,与其他四区的异军突起形成强烈反差。
第一步:改写原题
原题包含两句话,我们在首段中可以用一句话概括,但要确保覆盖三张表格的信息:
- 第一张表:城市总人口的变化
- 第二、三张表:人口分布的变化
The three tables give information on the population changes of New York City (NYC) in 1800, 1900 and 2000, and on the distribution of residents across the city's five districts over the same period.
第二步:概述(Overview)
概述部分要写出 3 张表格的特点:
- 表 1:纽约市的人口总数成倍激增。
- 表 2 & 3:Manhattan 的人口占比一路下滑,而其它 4 个城区的人口持续上升。
- 注:城区人口数的变化比较复杂,留到细节段细述。
Overall, the total population of NYC increased more than 100 times from 1800 to 2000. The percentage of residents living in Manhattan fell sharply. In contrast, the combined figure for the other four districts rose dramatically.
第三步:细节段(分三段写,逻辑更清晰)
📌 细节段一:第一张表(总人口)
用具体的数字写出人口整体激增的趋势,语言简洁。
In 1800, NYC had 79,216 residents. This number grew more than 40-fold to 3,437,200 in 1900, and continued this upward trend, reaching 8,009,185 in 2000.
📌 细节段二:1800–1900 年(Manhattan vs 其它四区)
按时间分成 2 段写,结构清晰,方便考官一眼看懂你的逻辑。城区之间的人口占比,一个上涨,另一个必然下降。
- 先写 1800–1900 年:Manhattan 与其它四区的人口数量、占比的变化。
Between 1800 and 1900, Manhattan remained the most populated district, accounting for 76% of the total population in 1800 and 54% in 1900. Both Manhattan and the other four districts experienced a huge population surge during this period. Specifically, the number of residents in Manhattan rose more than 30-fold and the population of the other four districts increased more than 80-fold.
📌 细节段三:1900–2000 年(关键反差)
- 再写 1900–2000 年:需特别注意 Manhattan,其人口数量略有下降,但人口占比却是大幅下跌📉。写出这个反差,说明你理出了关键信息,必然会让考官刮目相看。
From 1900 to 2000, the number of people living in Manhattan decreased by approximately 300,000 (from 1,850,093 to 1,538,096), and its proportion of the total population fell steeply from 54% to 19%. By contrast, the population of the other four districts grew sharply, rising to over four times its 1900 level. As a result, their combined share of the total population almost doubled over the next century, reaching 81% and overtaking Manhattan in 2000.
💡 高分提示
- 三张图的组合图,不要试图同时对比三张。
- 找到其中关联最强的两张图进行对比,写出反差或走势趋同。
- 硬把三张图混在一起写,逻辑会乱,反而丢分。
附:完整例文
The three tables give information on the population changes of New York City (NYC) in 1800, 1900 and 2000, and on the distribution of residents across the city's five districts over the same period.

Overall, the total population of NYC increased more than 100 times from 1800 to 2000. The percentage of residents living in Manhattan fell sharply. In contrast, the combined figure for the other four districts rose dramatically.

In 1800, NYC had 79,216 residents. This number grew more than 40-fold to 3,437,200 in 1900, and continued this upward trend, reaching 8,009,185 in 2000.

Between 1800 and 1900, Manhattan remained the most populated district, accounting for 76% of the total population in 1800 and 54% in 1900. Both Manhattan and the other four districts experienced a huge population surge during this period. Specifically, the number of residents in Manhattan rose more than 30-fold and the population of the other four districts increased more than 80-fold.

From 1900 to 2000, the number of people living in Manhattan decreased by approximately 300,000 (from 1,850,093 to 1,538,096), and its proportion of the total population fell steeply from 54% to 19%. By contrast, the population of the other four districts grew sharply, rising to over four times its 1900 level. As a result, their combined share of the total population almost doubled over the next century, reaching 81% and overtaking Manhattan in 2000.
你被雅思小作文的哪种图表虐过?