看到组合图不必慌!看懂图表关系,组合图就是送分题。
为什么组合图越来越常见?
组合图在雅思小作文里出现得越来越频繁。尤其是饼图,经常和别的图表搭配出现——剑17和剑19里都有这样的例子。
图表多了,信息量也随之增加,关键在于如何理清思路。
判断两个图表是各自独立,还是互相联系,直接决定了整篇文章的结构和得分。
今天以一道"表格 + 饼图"的组合题为例,讲讲如何通过理清图表关系来破解这类题目。
📌 原题(👉 点击查看原题)
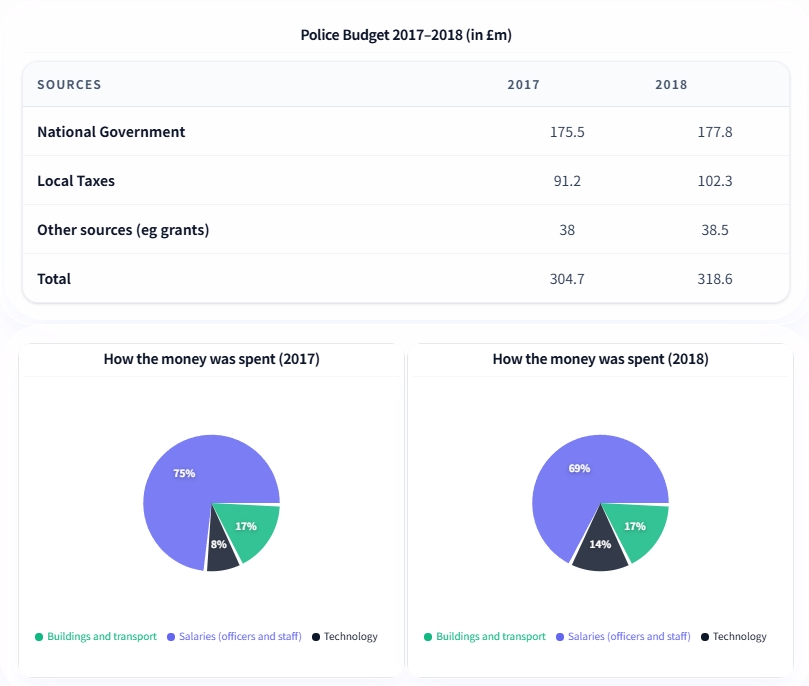
The table and charts below give information on the police budget for 2017 and 2018 in one area of Britain. The table shows where the money came from and the charts show how it was distributed.
📌 题目分析
表格与饼图虽然都涉及"钱",但信息并无直接交集:
| 维度 | 表格 | 饼图 |
|---|---|---|
| 内容 | 资金来源 | 资金用途 |
| 数据形式 | 具体数目(金额) | 比例分布(百分比) |
结论:两者信息各自独立,分开写、各自成段,逻辑最清晰。✅
📌 文章结构
| 段落 | 内容 |
|---|---|
| 第一段 | 改写题目(Introduction) |
| 第二段 | 概述(Overview):表格一句 + 饼图一句 |
| 第三段 | 细节:描述表格(资金来源) |
| 第四段 | 细节:描述饼图(资金用途) |
📌 逐段示范
第一段:改写题目
原题用了两句话,保留时间与地点,用 while 将表格和饼图的信息连成一句:
The table compares three sources of police budget in an area of Britain in 2017 and 2018, while the two pie charts illustrate the distribution of expenditure across three categories.
第二段:概述(Overview)
Overall, grants from the three sources, and therefore the total budget, all increased noticeably over the given period. As the pie charts show, salaries accounted for over two-thirds of the total spending in both years.
写法要点:
- 表格的总体趋势:三项来源均增长 → 总预算上升
- 饼图的突出特征:薪资始终占最大比例(超过 2/3)
- 概述不写具体数字,只写"大方向"
第三段:细节描述表格(资金来源)
三项资金来源均在增长,各有特点:
- National Government:最大资金来源
- Local Taxes:涨幅最大(+£11.1m)
- Other Sources:金额最小,涨幅也最小(+£0.5m)
In both years, the National Government provided the largest amount of funding, at £175.5 million in 2017 and £177.8 million in 2018. Local taxes were the second most important source, contributing £91.2 million in 2017 and rising to £102.3 million in 2018. Funding from other sources remained the lowest during these years, growing only marginally by £0.5 million.
词汇亮点:provided / contributing / remained — 动词多样化,避免反复使用 "was"。
第四段:细节描述饼图(资金用途)
三个用途的格局变化:
- Salaries:两年占比均最大,但从 75% 降至 69%
- Technology:增幅最大,近乎翻倍(8% → 14%)
- Buildings and transport:保持不变(17%)
As shown in the pie charts, spending on salaries for police officers and staff made up 75% of the total in 2017, but this figure fell to 69% in 2018. In contrast, the proportion spent on technology almost doubled, from 8% to 14%. Meanwhile, the share of spending on buildings and transport remained unchanged at 17% in both years.
词汇亮点:made up / doubled / remained unchanged — 同样注意动词多样性。
✅ 完整范文(185 words)
The table compares three sources of police budget in an area of Britain in 2017 and 2018, while the two pie charts illustrate the distribution of expenditure across three categories.
Overall, grants from the three sources, and therefore the total budget, all increased noticeably over the given period. As the pie charts show, salaries accounted for over two-thirds of the total spending in both years.
In both years, the National Government provided the largest amount of funding, at £175.5 million in 2017 and £177.8 million in 2018. Local taxes were the second most important source, contributing £91.2 million in 2017 and rising to £102.3 million in 2018. Funding from other sources remained the lowest during these years, growing only marginally by £0.5 million.
As shown in the pie charts, spending on salaries for police officers and staff made up 75% of the total in 2017, but this figure fell to 69% in 2018. In contrast, the proportion spent on technology almost doubled, from 8% to 14%. Meanwhile, the share of spending on buildings and transport remained unchanged at 17% in both years.
🔜 下期预告
【强关联的组合图】写法 — 当两张图表信息紧密相连时,又该如何组织结构?敬请期待!