
剑桥雅思21 Test 1 的这道小作文,图本身并不算特别难。
4个行业,4个时间点,数据也比较规整。
真正让人纠结的,反而是写的时候:
四条线都有变化,到底应该怎么组织?
如果完全按照行业一个一个写,当然也能写。但这样很容易变成“这个行业从多少变成多少,另一个行业又从多少变成多少”。
而这张图其实有更清楚的写法。
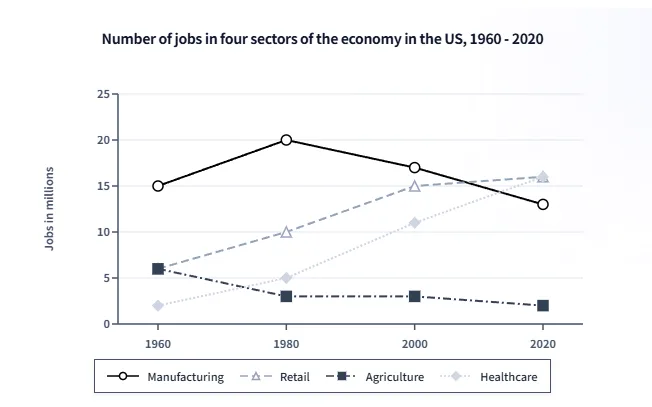
The graph below gives information about the number of jobs in four sectors of the economy in the US between 1960 and 2020.
先看趋势,其实四条线很好分
把数据简单列出来:
| 行业 | 1960 | 1980 | 2000 | 2020 |
|---|---|---|---|---|
| Manufacturing | 15m | 20m | 17m | 13m |
| Retail | 6m | 10m | 15m | 16m |
| Healthcare | 2m | 5m | 11m | 16m |
| Agriculture | 6m | 3m | 3m | 2m |
看到这里,基本就能发现:
Retail 和 Healthcare 是往上走的;
Agriculture 是一路往下;
Manufacturing 则比较特别,1980 年之前上升,之后开始下降。
所以如果要分组,我会把 Retail 和 Healthcare 放在一起,Manufacturing 和 Agriculture 放在一起。
这里有意思的地方是,同一组里的两条线并不需要走势完全一样。
比如 Manufacturing 并不是一条下降线,但它和 Agriculture 有一个共同点:2020 年的就业数量都低于 1960 年。
而 Retail 和 Healthcare 的共同点则更加明显——两者都持续增长,而且最后都达到 1600 万。
这样分组以后,文章就不需要围着四条线转,而是可以围着几个比较关系来写。
Overview 其实也不用写得太复杂
这张图最明显的变化就是:
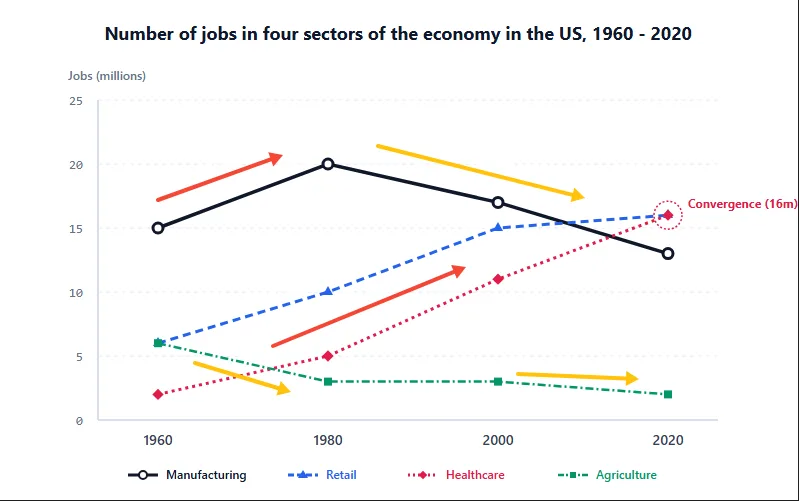
Retail 和 Healthcare 增长,Agriculture 下降,Manufacturing 先升后降。
另外,2020 年还有一个比较醒目的变化:
Healthcare 和 Retail 都达到 1600 万,超过了 Manufacturing 的 1300 万。
所以 Overview 可以直接写:
Overall, employment in retail and healthcare increased considerably over the period, while agriculture experienced a steady decline. Manufacturing followed a different pattern, rising to a peak in 1980 before falling to below its initial level by 2020. By the end of the period, healthcare and retail had both reached 16 million jobs, overtaking manufacturing.
这里没有必要为了所谓的“高分”把 Overview 写得特别复杂。
Task 1 的 Overview 本来就应该比较简洁,关键是让读者看完以后知道:
这60年里,哪些行业在增长,哪些在减少,以及最后的格局发生了什么变化。
两条增长线,可以放在一起比较
Healthcare 的变化最明显。
它从1960年的200万开始,到2020年已经达到1600万。
Retail 的起点高一些,是600万,但增长也比较稳定,1980年达到1000万,2000年达到1500万,最后同样是1600万。
因此这一段可以写:
Turning to the two growing sectors, healthcare saw the most substantial increase, rising from just 2 million jobs in 1960 to 16 million in 2020. Its growth was particularly strong after 1980, when the figure more than doubled from 5 million to 11 million by 2000. Retail also increased steadily, from 6 million to 10 million and then 15 million over the same period, before reaching the same level as healthcare at 16 million in 2020.
这一段真正有价值的地方,其实不是用了多少“高级词”。
而是两条线放在一起之后,比较自然地就出现了:
Healthcare 起点更低、增长幅度更大;Retail 起点更高,但增长比较稳定。
最后两者又在1600万的位置汇合。
数据一旦这样组织,文章就不会只是“报数字”。
Manufacturing 的重点是“先升后降”
再看另外两条线。
Manufacturing 一开始是四个行业中最高的,1960年有1500万,到1980年进一步升到2000万。
但这也是它的最高点。
之后从1700万降到1300万,最后甚至低于1960年的起点。
Agriculture 的变化则更直接:
600万 → 300万 → 300万 → 200万。
所以可以写:
By contrast, manufacturing and agriculture both ended the period with fewer jobs than they had initially, although their patterns differed. Manufacturing started as the largest sector, with 15 million jobs, and climbed to a peak of 20 million in 1980. It then declined steadily, reaching 13 million in 2020, which was below its 1960 figure. Agriculture, meanwhile, fell sharply from 6 million to 3 million between 1960 and 1980, remained unchanged in 2000, and then declined slightly further to 2 million by 2020.
这里其实不用刻意把 Manufacturing 描述成“下降行业”。
因为它前20年明明是在增长。
写成 先达到峰值,再持续下降,反而更加准确。
完整范文
The line graph illustrates changes in the number of jobs across four economic sectors—manufacturing, retail, healthcare and agriculture—in the US between 1960 and 2020.
Overall, employment in retail and healthcare increased considerably over the period, while agriculture experienced a steady decline. Manufacturing followed a different pattern, rising to a peak in 1980 before falling to below its initial level by 2020. By the end of the period, healthcare and retail had both reached 16 million jobs, overtaking manufacturing.
Turning to the two growing sectors, healthcare saw the most substantial increase, rising from just 2 million jobs in 1960 to 16 million in 2020. Its growth was particularly strong after 1980, when the figure more than doubled from 5 million to 11 million by 2000. Retail also increased steadily, from 6 million to 10 million and then 15 million over the same period, before reaching the same level as healthcare at 16 million in 2020.
By contrast, manufacturing and agriculture both ended the period with fewer jobs than they had initially, although their patterns differed. Manufacturing started as the largest sector, with 15 million jobs, and climbed to a peak of 20 million in 1980. It then declined steadily, reaching 13 million in 2020, which was below its 1960 figure. Agriculture, meanwhile, fell sharply from 6 million to 3 million between 1960 and 1980, remained unchanged in 2000, and then declined slightly further to 2 million by 2020.
这道题还有几个挺好用的表达
不需要专门背一整套“折线图高级词”,这几个基本够用了。
达到峰值后下降
rise to a peak before falling
从 A 增加到 B
increase from A to B
达到相同水平
reach the same level as
低于起始水平
fall to below its initial level
比如:
Manufacturing rose to a peak of 20 million in 1980 before falling to 13 million in 2020.
这种句子其实已经很好用了。
回到这道题,最值得注意的其实是“分组”
四条线看起来很多,但真正需要抓的变化并不多:
- Healthcare:2m → 16m
- Retail:6m → 16m
- Manufacturing:15m → 20m → 13m
- Agriculture:6m → 3m → 2m
把它们放在一起之后,图表的结构就比较清楚了。
两条增长线 + 一条先升后降的线 + 一条持续下降的线。
再往下看一步,还能发现一个很好的比较:
1960 年 Manufacturing 明显领先其他行业;到了 2020 年,Healthcare 和 Retail 都超过了它。
这类“起点—过程—终点”的变化,往往比把每一个年份的数字都写出来更值得关注。
所以多线图真正难的地方,很多时候不是“数据太多”,而是怎么从这些数据里找到一条比较顺的写作主线。
这道题的主线,其实已经藏在四条线的走势里了。