
拿到柱状图,你做的第一件事应该是什么?
是先看横轴,还是读数据?
都不是。
第一件事应该是:判断它是动态图还是静态图。
为什么?因为“动静有别”:
- 动态柱图,看的是趋势: 哪些在升?哪些在降?哪些浮动?
- 静态柱图,看柱子高低: 谁最多?谁最少?谁和谁形成反差?
我将用近期考过的两道真题,把动态柱图和静态柱图的写作思路讲清楚。
全文约2000字,请耐心慢读,建议收藏。
先摆结论:
| 类型 | 判断标准 | 核心写作思路 |
|---|---|---|
| 动态柱图 | 有 2 个及以上时间点 | 看趋势:上升、下降、浮动 |
| 静态柱图 | 没有时间维度或者只有 1 个时间点 | 比高低:找极值、做对比 |
动态柱图
展示数据随时间(年份、月份等)变化而变化。横轴或图例中包含明确的时间信息,如 2010, 2015, 2020 等。
例如:2010-2025年间,某城市人口数量的变化。
静态柱图
没有时间维度或者仅有一个时间点的数据。
例如:2020年四个国家(中国、美国、日本、德国)的咖啡消费量。
二者的根本区别在于:有没有时间变化。
动态柱图和静态柱图各具特点,写作思路截然不同。
一、动态柱图
动态柱图在考试中出现的概率远高于静态柱图。四个柱状图考题中,三道都是动态图。
柱图的数据随时间呈现变化趋势:上升、下降、几乎不变或在一定范围内浮动。
看原题:
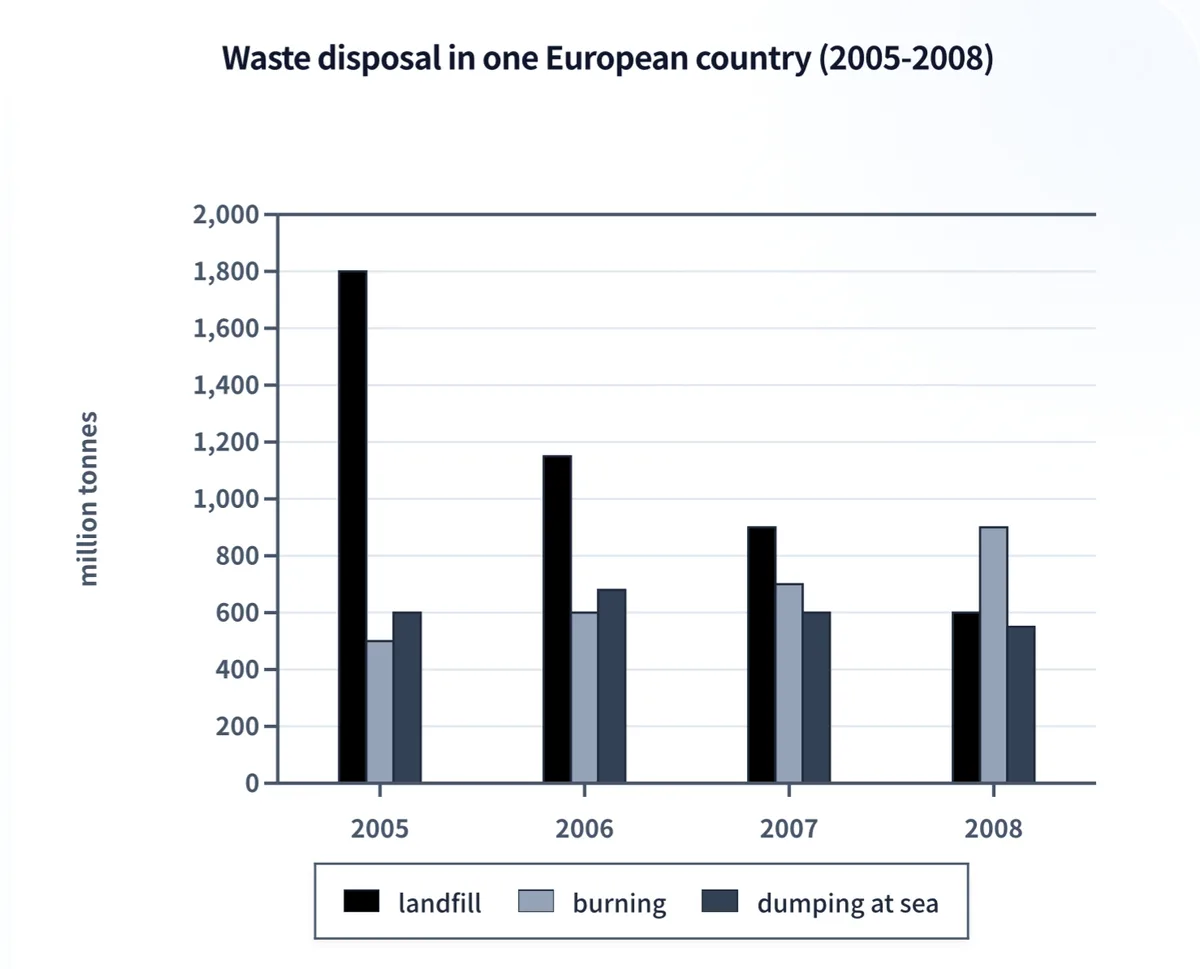
The chart below shows the waste disposal in one European country in four years: 2005, 2006, 2007, and 2008.
第一部分,改写原题
The given bar chart illustrates how the waste was disposed of in a European country in four separate years.
改写清单:
- 改主语 The chart below : The given bar chart
- 改动词 shows : illustrates
- 改宾语(将名词改为从句) waste disposal : how the waste was disposed of
- 改时间表达 in four years: 2005, 2006, 2007, and 2008 : in four separate years
第二部分:概述
概述就是用 2 句话写出柱状图的 2 个显著特征。
动态柱状图的特征看每个柱子随时间变化的整体走势,和折线图类似。
如果把每个柱子在不同年份的数据连起来,就是一个折线图。
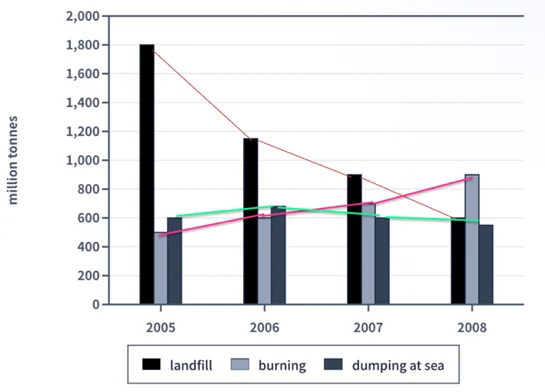
各个柱子随时间变化呈现出如下趋势:
- 填埋(landfill)方式: 一路下降
- 焚烧(burning)方式: 稳步上升
- 倾倒入海(dumping at sea): 小范围内浮动
概述如下:
Overall, the amount of waste buried in landfill decreased sharply while the amount of waste burned increased steadily over this period. Meanwhile, the volume of waste dumped into the sea displayed minor fluctuations.
- 第一句写反差:“填埋”和“焚烧”一升一降;
- 第二句写倾倒入海:稍有浮动。
第三部分:细节描述分 3 段写
细节部分需要描述所有的柱子,我们不可能写到所有的时间和数据,所以必须选择重要的、有特点的数据。
动态柱图的特点数据有哪些?4 类:起点、终点、极值、交点。
1. 先写显眼的“填埋”方式(前 3 年处理的垃圾量都是最大的,其整体走势下滑):
First, landfilling was the most widely-used way of waste disposal before 2008. In 2005, 1,800 million tons of waste were dealt with through landfilling, roughly three times the amount of either of the other two methods. In the following years, this figure declined dramatically, ending at 600 million tons in 2008, overtaken by the amount of waste incinerated.
2. 用 by contrast 引出与之形成反差的“焚烧”方式:
By contrast, the amount of waste burned rose consistently from 500 million tons in 2005 to about 900 million tons in 2008, making it the dominant method by the end of the period.
3. 最后写倾倒入海的垃圾处理方式(内容包括:数值浮动的范围,最高点和最低点):
Finally, the volume of waste that was thrown into the sea fluctuated between 580 and 700 million tons. The figure reached its peak in 2007 at 700 million tons, and dropped to the lowest point at 580 million tons in 2008.
二、静态柱图
原题:
The chart below shows the percentage of people choosing different means of transport for different purposes in the UK in 2013.
(Percentage of people choosing different means of transportation)
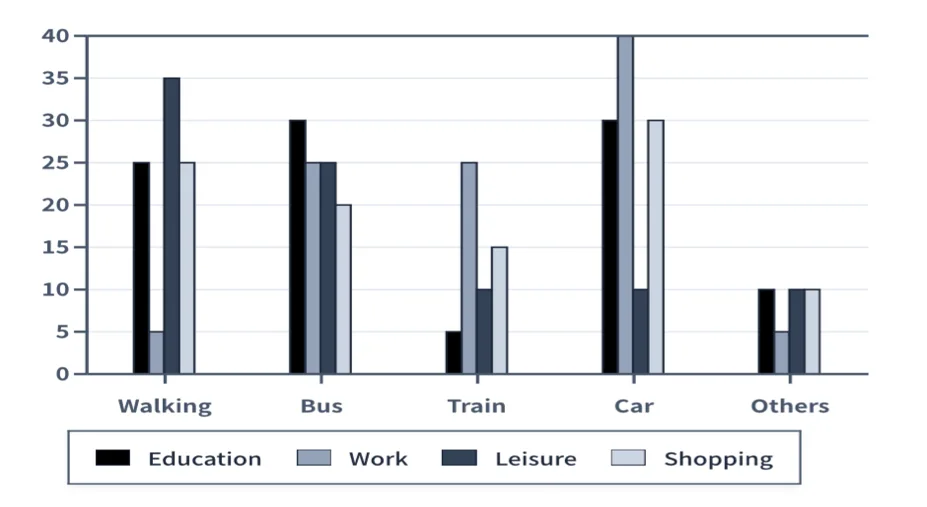
题中只有一个时间:2013年,说明数据变化与时间无关。这是一个静态柱图。
第一部分,改写原题
The given bar chart demonstrates the proportion of people using different modes of transportation for four purposes in the UK in 2013.
改写清单:
- 改主语 The chart below : The given bar chart
- 改动词 shows : demonstrates
- 用同义词改宾语:
- percentage : proportion
- using : choosing
- means of transport : modes of transportation
第二部分,概述
静态图的特征从对比、极值着手;对比包括:组间对比和组内对比。
1. 组间对比
横向观察所有的柱子,找极值。
- 最高的 2 个柱子:开车上班的 40%,步行休闲娱乐的 35%
- 最低的 3 个柱子:走路上班的 5%,使用其它交通方式去上班的 5%,坐火车去休闲娱乐的 5%
有 3 个极值都与上班相关。概述的第一句就写它了:
Overall, the majority of commuters drove to work, while only a small fraction walked or used other modes of transport.
2. 组内对比
观察每一组柱子,bus 和 others 组内的各个柱子的高低相差不大。这表示,无论出行目的为何,选择公交车都比较多,而选择 others 都少。
二者形成反差。概述的第二句有了:
Across all four purposes — education, work, leisure, and shopping — buses were used quite consistently while other ways were chosen far less frequently.
(注:consistently 写出了组内各个柱子高低相差不大)
第三部分,细节描述
这道题有 20 根柱子,数据呈现复杂。细节描述的要点在于选择有特点的数据。
静态柱图的特点数据有哪些?2 类:
- 极值: 最大值,最小值;
- 形成对比的数据: 如一致或相似的,或形成反差。
5 种交通方式,4 种出行目的。选择少的选项着手,即“工作,教育,休闲娱乐和购物”,按序对比着写。根据“详略得当”的原则,有特点的多写。
1. 先写有特点的“工作”,它贡献了 3 个极值,相当抢眼:
In terms of commuting, most commuters, 40%, went to work by car. Buses and trains each carried 25% of commuters to work, while only a minority walked to the office or chose other modes of transportation: 5% each.
2. 教育紧随其后:
With respect to education, buses and cars were the most popular choices, each representing 30%. Meanwhile, 25% of learners went to class on foot.
3. 我们把“休闲娱乐”和“购物”放在一起对比着写:
| 出行目的 | 使用的主要交通工具 | 使用的次要交通工具 |
|---|---|---|
| 休闲娱乐 | 步行,公交车 | 火车,其它,开车 |
| 购物 | 步行,公交车,开车 | 火车,其它 |
- 二者的共同点: 用得多的是步行和公交车,较少选火车和其它。
- 二者的不同点: 购物的选开车的多,但是休闲娱乐的选开车的少。
Turning to leisure and shopping, people preferred walking and buses. Specifically, 35% and 25% of people walked and took buses for leisure activities respectively. Similarly, 25% of people walked for shopping and another 25% went shopping by bus. In addition, many shoppers, 30%, drove for shopping, but only 10% of people drove for leisure reasons. Trains or others were rare options for leisure and shopping.
要点小结
- 动态柱图 → 连点成线,看趋势(升 / 降 / 波动)
- 静态柱图 → 对比高低,找极值(最高 / 最低 / 反差)
开始练习吧!
-
分类练习:
任意找几道柱状图题,快速判断它们是动态柱图还是静态柱图。 -
写作练习:
分别选择一道稍有挑战的动态柱图和一道静态柱图,按照本文的分析思路,仿照例文各写一篇完整的小作文。