
这道题最早出现在2007年。据考生回忆,7月25日这场考试中又出现了这道题(考生回忆版),说明一些经典老题型仍然有重复出现的可能。
不过,比起单纯背“老题答案”,更值得关注的是:这类双柱状图到底应该怎么处理。
我批改这类Task 1作文时,经常看到一个问题:很多同学并不是看不懂数据,而是不知道哪些数据值得写。
结果就是——开头看懂了图,主体开始逐个报数字,写完200多词,却发现文章只是“翻译图表”,没有真正完成比较。
这道题就是一个很典型的例子。
它同时包含:
- 城市和农村两个场景;
- 白天和夜间两个时间维度;
- 四种不同噪音来源。
如果没有提前想清楚数据之间的关系,很容易一开考就陷入数字堆积。
今天结合平台上这道题的6分和8分范文,看看两篇文章的差距到底在哪里,以及双柱状图怎样才能写出更高分。
这道题(417,考生回忆版真题)考查什么
题目:
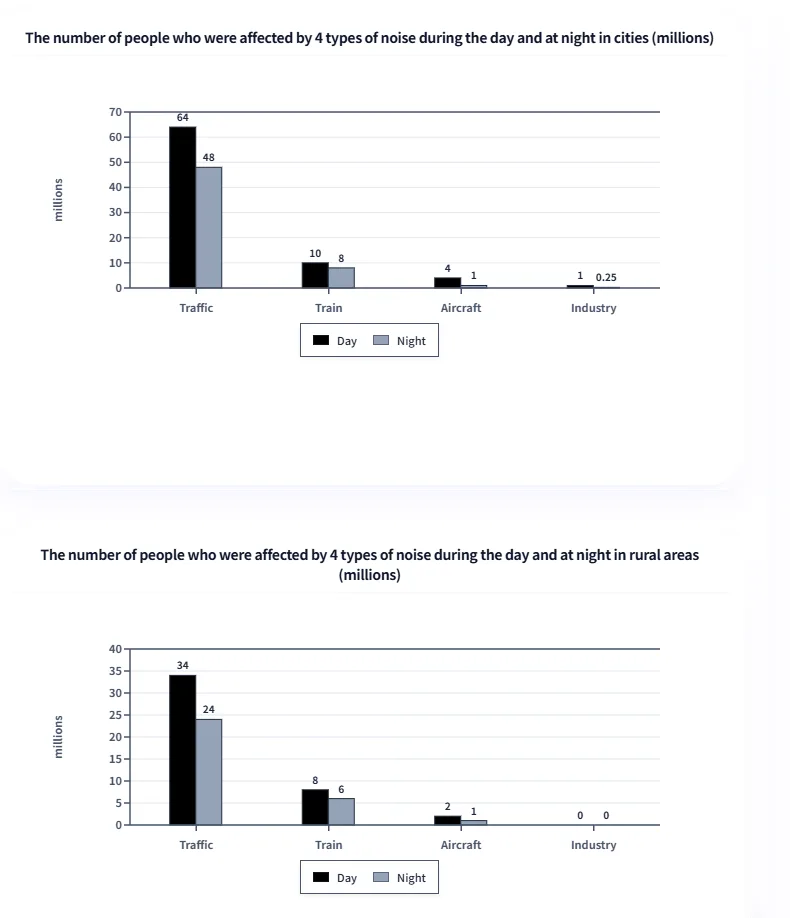
The charts below show the number of people in Europe who were affected by four types of noise by day and by night in cities and rural areas in 2007.
很多同学第一次看到这道题,会觉得信息量比较大:
- 两个地区;
- 两个时间段;
- 四种噪音来源。
但实际上,图表真正考查的不是“能不能把所有数字写出来”,而是能不能找到其中最重要的数据关系。
为了方便后续分析,将图表数据整理如下:
题目数据整理(单位:百万)
| 噪音类型 | 城市白天 | 城市夜间 | 农村白天 | 农村夜间 |
|---|---|---|---|---|
| 交通 | 64 | 48 | 34 | 24 |
| 火车 | 10 | 8 | 8 | 6 |
| 飞机 | 4 | 1 | 2 | 1 |
| 工业 | 1 | 0.25 | 0 | 0 |
这道题相比普通双柱图,有几个特别值得注意的地方
这道题表面上只是一个城乡噪音对比图,但实际上包含了几个Task 1中非常典型的数据特点。
很多同学失分,并不是因为不会描述数据,而是没有意识到:
不同数据在图表中的重要程度并不一样。
1. 数据跨度非常大,不能平均分配篇幅
这道题最明显的特点,是不同噪音来源之间存在巨大的数量差异。
例如:
- 城市交通噪音白天影响64 million people;
- 城市工业噪音夜间只有0.25 million。
两者相差超过250倍。
如果按照“四种噪音平均展开”的方式写,很容易出现一个问题:
花大量篇幅描述飞机和工业噪音,却忽略了真正决定图表趋势的交通噪音。
这类题的处理原则是:
先抓量级最高的数据,再补充极端低值。
因此:
- 交通噪音应该作为主体重点;
- 火车作为第二梯队进行比较;
- 飞机和工业只需要简洁说明。
高分Task 1不是覆盖所有数字,而是知道哪些数字值得展开。
2. 0和接近于0的小数,是这道题的另一个考点
农村工业噪音的数据是0。
城市工业噪音夜间也只有0.25 million。
这类数据在Task 1中比较特殊,因为它们不是普通的“低一点”,而是接近不存在。
很多学生会机械写:
The figure was 0.
或者:
The number of people affected was zero.
语法没有问题,但表达比较生硬。
面对这类极低数据,可以考虑:
- had virtually no impact
- remained negligible
- affected no residents
- was almost non-existent
不过需要注意:
不要为了追求“高级表达”而牺牲准确性。
Task 1中,准确表达数据含义永远比堆砌词汇重要。
3. 这道题隐藏了一个重要比例关系:农村约为城市的一半
除了看单个数字,这道题还有一个容易被忽略的信息:
农村交通噪音:
- 白天34 million;
- 夜间24 million。
城市交通噪音:
- 白天64 million;
- 夜间48 million。
可以发现:
农村交通噪音人数约为城市的一半。
这种比例关系比单纯重复两个数字更有价值。
因为它体现的是考生是否真正理解图表,而不是只完成数字搬运。
类似地:
- 农村火车噪音也是城市的较低水平;
- 飞机噪音整体减少;
- 工业噪音几乎消失。
这些关系才是主体段比较的基础。
4. 不同类别量级差异明显,Overview必须抓“大趋势”
这道题如果只写:
Traffic noise was the highest and industrial noise was the lowest.
虽然正确,但信息量不足。
真正值得写进Overview的是:
- 交通噪音在所有类别中占明显优势;
- 所有噪音类型都是白天高于夜间;
- 城市整体受影响人数高于农村;
- 工业噪音在农村几乎不存在。
这些规律决定了后面主体段的数据选择。
这类双柱状图最容易出现的问题
1. 看到数字就写,缺少数据之间的比较
很多学生写Task 1时,会采用这样的方式:
交通噪音白天影响64 million people,晚上48 million;火车白天10 million,晚上8 million……
单看句子没有语法问题,但整篇文章会变成“数据转述”。
而Task 1评分标准中的Task Achievement,并不是要求考生把所有数字搬进去,而是要求选择重点信息,并进行合理比较。
这道题最值得写的其实不是每一个数字,而是几个明显规律:
- 交通噪音在所有情况下都是最高;
- 所有噪音类型都是白天高于夜间;
- 城市数据整体明显高于农村。
这些规律才是文章的骨架。
2. 对比关系表达不准确
有些同学喜欢写:
On the contrary, rural traffic noise affected 34 million people.
这里的问题在于:
On the contrary通常用于否定前面观点,而不是简单引出另一个对比数据。
更自然的表达包括:
- By contrast
- Whereas
- Compared with urban areas
- A similar pattern was observed in rural areas, although at a lower level
3. Overview写到了现象,却没有抓住主要规律
很多6分左右作文的Overview会写:
Traffic noise was the highest, while industrial noise was the lowest.
这句话没有错。
但对于这道题来说,信息量还不够。
更完整的Overview应该注意:
第一,交通噪音在所有类别中占明显优势;
第二,无论城市还是农村,无论哪一种噪音,白天受影响人数都高于夜间;
第三,城市所有类别的数据都高于农村。
这三个规律基本决定了主体段应该怎么组织。
4. 遇到0这个数据,不要只会机械描述
农村工业噪音的数据为0。
很多学生会写:
Industrial noise recorded 0 for both daytime and nighttime.
虽然没有语法错误,但表达比较机械。
Task 1中,遇到极端数据,可以适当换一种自然表达。
重点不是“换高级词”,而是让数据描述更符合英语表达习惯。
8分范文和6分范文对照
8分范文:
The bar charts present data on the number of Europeans exposed to four noise sources in urban and rural areas in 2007, categorized by daytime and nighttime.
Overall, it is clear that traffic noise was overwhelmingly dominant in all contexts, whereas industrial noise had a negligible effect, especially rurally. Additionally, daytime exposure consistently exceeded nighttime exposure, and urban residents endured substantially higher noise impact than their rural counterparts.
In cities, traffic noise was dramatically the leading source, affecting 64 million people during the day and 48 million at night – figures far larger than the combined totals of the other three types. Train noise followed, with 10 million impacted by day and 8 million by night, whereas aircraft and industrial noise affected far fewer, with daytime figures of 4 million and 1 million, respectively. Industrial noise at night was almost negligible at 0.25 million. A clear pattern of higher daytime than nighttime exposure was evident for all sources.
In rural areas, traffic again dominated but at considerably lower levels: 34 million by day and 24 million by night, approximately half the urban counts. Train and aircraft noise were correspondingly reduced, with industrial noise virtually vanishing – no rural residents were affected by it at any time. The consistent day-night disparity persisted, yet the overall scale of noise impact was markedly lower in the countryside.
6分范文:
The two bar charts give information about how many people in Europe suffered from four types of noise—traffic, trains, aircraft, and industry—in cities and rural areas in 2007, during the day and at night.
Overall, it can be seen that traffic was the dominant noise source, affecting far more individuals than any other type in both urban and rural settings and at both times. Industry noise had the lowest impact. Another key feature is that daytime noise disturbance was always greater than nighttime disturbance, and city dwellers were consistently more affected than rural residents.
Looking at the city data, traffic noise affected 64 million people in the day and 48 million at night, which were the highest numbers. Train noise was the second most common, with 10 million during the day and 8 million at night. Aircraft noise figures were 4 million and 1 million respectively, while industrial noise was minimal, at 1 million and 0.25 million.
In rural areas, the situation was similar but on a smaller scale. Traffic noise was again the greatest, with 34 million affected during the day and 24 million at night. Train noise followed with 8 million and 6 million, and aircraft noise was 2 million and 1 million. Industrial noise did not affect anyone in the countryside, recording 0 for both daytime and nighttime.
两篇范文真正的差距在哪里?
很多同学看到8分范文,会第一反应认为:
高分=用了更多高级词。
但这其实不是核心。
两篇文章最大的区别,是8分范文更主动地处理数据关系。
| 维度 | 6分范文 | 8分范文 |
|---|---|---|
| TR | 数据描述较完整,但比较主要停留在单句层面 | 提炼出交通主导、昼高夜低、城乡差异等核心规律 |
| CC | 按城市、农村分块展开,逻辑清楚但连接较普通 | 使用approximately half the urban counts等表达,让两个场景产生联系 |
| LR | affected、noise、greatest等词重复较多 | 使用exposed to、impacted、counterparts等表达增加变化 |
| GRA | 句式以简单陈述为主 | 对比结构、分词短语、补充说明使用更灵活 |
写完双柱状图后,可以检查这3个问题
下次遇到类似题目,不要急着抄数字。
先问自己:
1. 哪个数据在所有类别中最高?
它通常决定主体段重点。
2. 不同维度之间有没有共同趋势?
比如:
- 白天是否都高于晚上?
- 一个地区是否整体高于另一个地区?
这些往往是Overview的重要来源。
3. 有没有明显比例关系?
例如这道题:
农村交通噪音人数约为城市一半。
这种关系比单纯重复两个数字更有价值。
最后,练习这类题时,不建议只看8分范文背表达。
更有效的方法是:
先自己写一版,再对照6分范文,看自己是不是也陷入了机械报数;
然后再看8分范文,重点学习它如何筛选数据、组织比较。
Task 1真正拉开分数差距的,往往不是你记住了多少词,而是你能不能看出数据背后的关系。