
你是不是也纠结过:两张图分开写还是合一起写?合一起的话,连接点在哪儿?
读完这篇,组合图就是你的送分题。
雅思小作文中的数据类图表包括折线图、柱状图、饼图和表格。它们有时候两两同时出现,成为组合图表题。
3个图的组合,比较少见。有逻辑、有方法就不难写。
写组合图的关键在于识别和写出两个图之间的关联。
今天这篇文章,以柱状图+柱状图、柱状图+饼图的雅思真题为例,讲透组合图的思考路径和写作方法。
用真题示范,讲透逻辑,总结方法,让你可以举一反三,考试不慌!
一、柱状图+柱状图
原题:
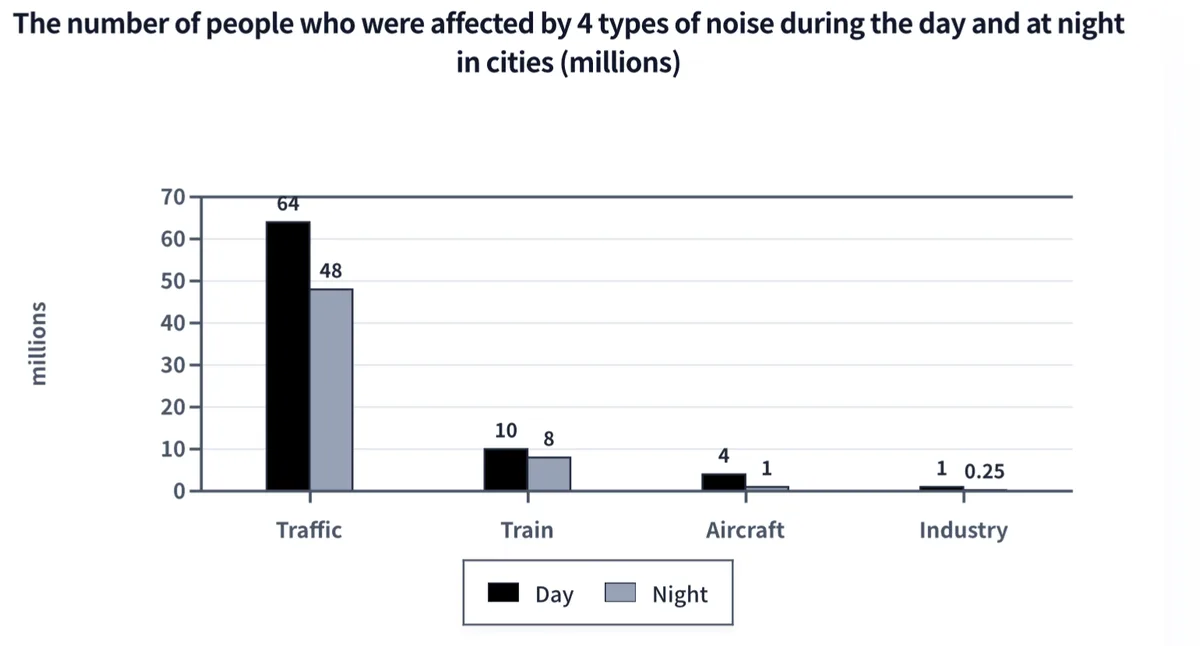
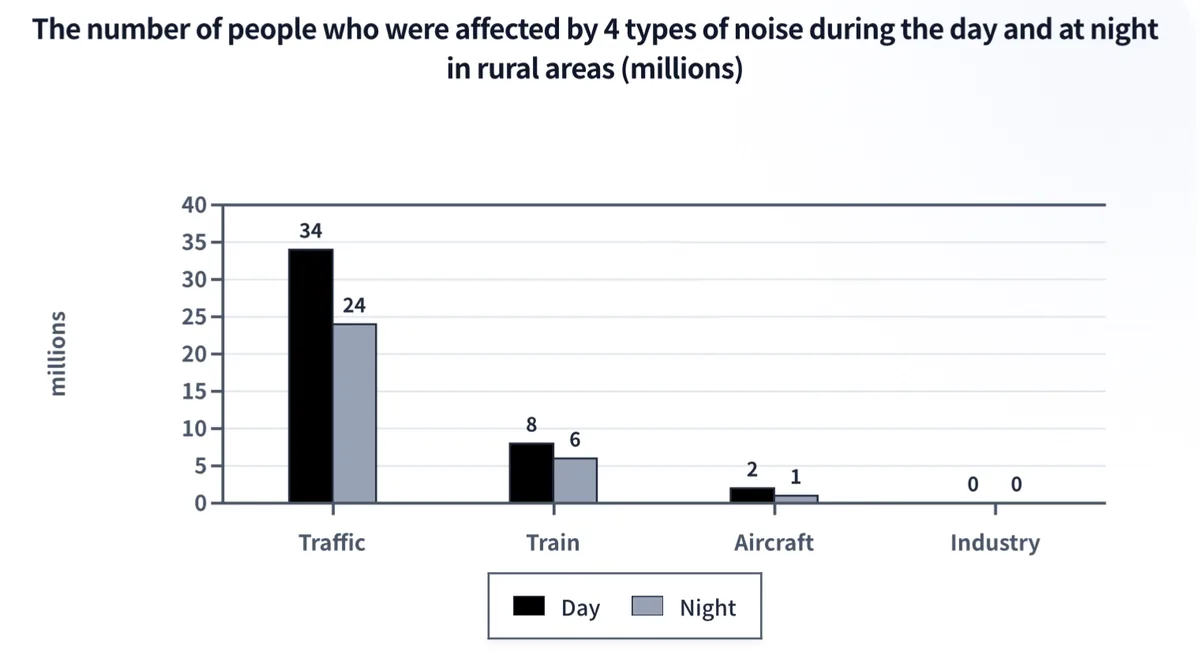
The charts below show the number of people in Europe who were affected by four types of noise by day and by night in cities and rural areas in 2007.
第一部分,开头,改写原题
The two bar charts compare the number of residents living in cities and countryside across Europe who were disturbed by noise from traffic, trains, aircraft and industry during the daytime and nighttime in 2007.
这句话很长,36个单词,信息量巨大,读起来累!
把它拆成两句话,让考官可以喘口气:
The two bar charts compare the number of residents living in cities and countryside across Europe who were disturbed by noise during daytime and nighttime in 2007. The noise came from traffic, trains, aircraft and industry.
第二部分 概述
用2句话写出图表的2个最突出的特征。
2个图是强关联,它们展示了同类信息:4个噪音类型,白天和晚上的影响差异。
不同的是受噪音影响的人群:一个是城市居民, 一个是乡村居民
对于强关联的组合图,概述部分的突出特征一定要把两个柱图联在一起对比着写。
- 四类噪音中,无论城市或乡村,交通噪音影响的人数最多,是其它3类噪音的总和还多。
- 纵向比较这2个图:城市居民受影响人数都多于乡村居民。
- 分别观察这2个图会发现:白天受影响人数都多于晚上
概述如下:
Overall, traffic was the most disruptive source of noise in both settings, affecting far more people than the other three sources combined. Consistently, more people were disturbed during the day than at night, and city residents who were affected outnumbered those living in the countryside.
第三部分:细节描述
观察图表,对其呈现的数据信息进行分类。有几类,就写几段。
按“地点”分类最直观,2个柱图各成一段, 即城市一段,乡村一段。
先写城市, 从高往低依次写:交通-火车-飞机-工业。对比白天和夜间受影响的人数。
In cities, traffic noise affected 64 million people by day, falling to 48 million at night. Rail noise disturbed 10 million urban residents in the daytime and 8 million at night, while aircraft and industrial noise had a smaller impact, affecting 4 million and 1 million respectively during the daytime, dropping to 1 million and 0.25 million at night.
再写乡村,同样的思路。
从高往低依次写:交通-火车-飞机-工业,对比白天和夜间受影响的人数。
In rural areas, traffic troubled 34 million by day and 24 million at night, rail noise affected 8 million and 6 million, and aircraft disturbed 2 million and 1 million. Notably, no rural residents reported industrial noise.
二、柱状图+饼图
搞定了“柱状图+柱状图”的组合,下面来看更复杂的“柱状图和饼图”的组合。
原题:
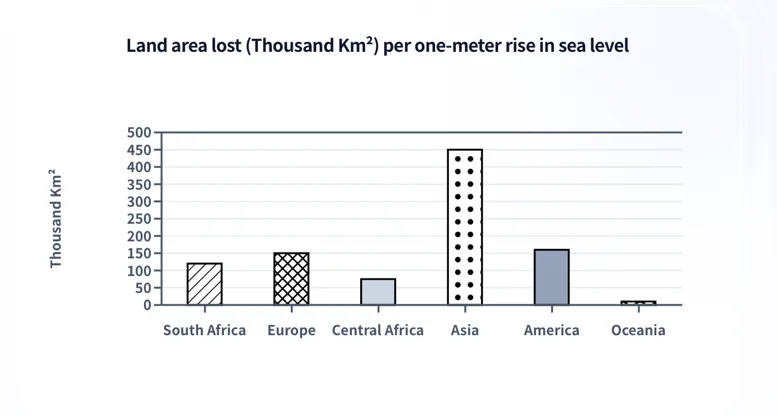
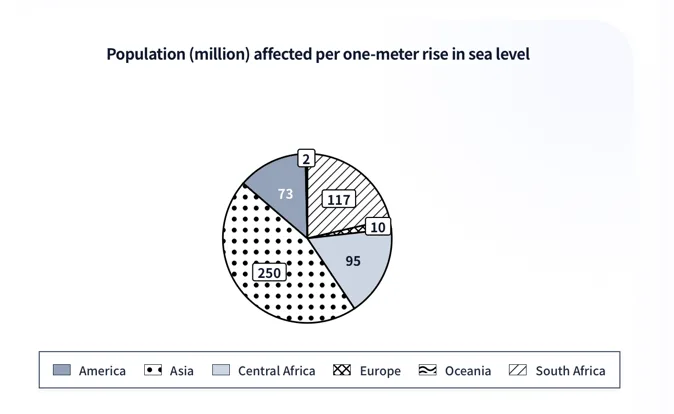
The charts below show the land area lost (Thousand Km²) per one-meter rise and population (million) affected per one-meter rise in sea level in the predicted future.
题目意思:根据预测,在6个地区,海平面每上升一米所造成的陆地面积损失以及受影响的人口数量。
第一部分,开头
直接改写原题
原题以The two charts开头,一句话包含2个图的信息,改写时,可将2个图分开写,用while连接。
The bar chart compares the projected land areas lost in six regions for one-meter rise in sea level, while the pie chart displays the population that would be affected by this change in the future.
第二部分, 概述
概述:用2句话概括描述图表的2个显著特征。
组合图的特征一定找到两个图的关联,写出跨图比较。
- 通过”极值”找到关联
柱状图:亚洲失去的面积最大,大洋洲最小。
饼图:亚洲受影响的人口最多,大洋洲最少。
第一个显著特征就写这一组“极值+反差“。
- 亚洲和大洋洲在两个图中占据了第一名和最后一名。
剩下的四个地区在柱图和饼图的排序是否一致?
答案是:不一致!
如何迅速在这4个找到“不一致”的典型呢?
我们在2个图中去找倒数第二名。
柱状图:中非是倒数第二名
中非 (Central Africa):土地流失较少,但受影响人口较多(95 million),排序第3。
饼图:欧洲是倒数第二名
欧洲 (Europe):受影响人口较少(10 million),但其土地流失较大,排序第3。
概述中,可以不提具体的地区,只写数据呈现出的规律。
综合以上分析,概述如下:
Overall, Asia is expected to see the greatest impact in terms of both land loss and population affected, whereas Oceania is projected to have the lowest figures in these two aspects. However, the ranking of land loss is not always consistent with the number of people affected.
两个对比项的排名如下,供大家参考:
| 地区 | 土地流失排序 (柱状图) | 受影响的人口数排序 (饼图) |
|---|---|---|
| Asia | 1 | 1 |
| America | 2 | 4 |
| Europe | 3 | 5 |
| South Africa | 4 | 2 |
| Central Africa | 5 | 3 |
| Oceania | 6 | 6 |
第三部分,细节描述
将6个地区分2组,写2段。
先写反差组:Asia, Oceania
它们贡献了4个极值:土地流失面积最大和最小,受影响人口最多和最少。
It is predicted that Asia will lose approximately 450 thousand km² of land, almost three times the figure for America. It will also record the largest affected population, at 250 million. In contrast, Oceania is projected to lose a small land area, with 2 million people affected, the smallest number among the six regions.
细节描述的第2段写其它四个地区。
特点是:土地流失面积和受影响人口数的名次并不对应。
根据“受影响人口数量”(看饼图),从大到小依次写。
South Africa (117 million)- Central Africa (95)-America (73) – Europe (10)
Turning to the rest of the regions, South Africa is expected to have 117 million people affected — ranking second in this regard — despite having only the fourth largest land loss. Central Africa, with 95 million affected residents, exceeds America's 73 million, although America is projected to lose substantially more land. The sharpest contrast is observed in Europe, which ranks third in land loss (150 thousand km²) but is forecast to have only 10 million people affected.
📌 小结:组合图写作的3个要点
- 找关联:极值、排序、反差、趋势一致。
- 用关联写出跨图对比,不要各说各话。
- 细节部分按逻辑分组(按地点、趋势、走向等),每组内部再按数据高低排序。